Your Dashboard
As you start implementing popups, push notifications and other campaigns you will want to analyze the results by time, conversions and geofences to gage what is working and where you need to intervene. This is the front row seat to your site’s conversion lift.
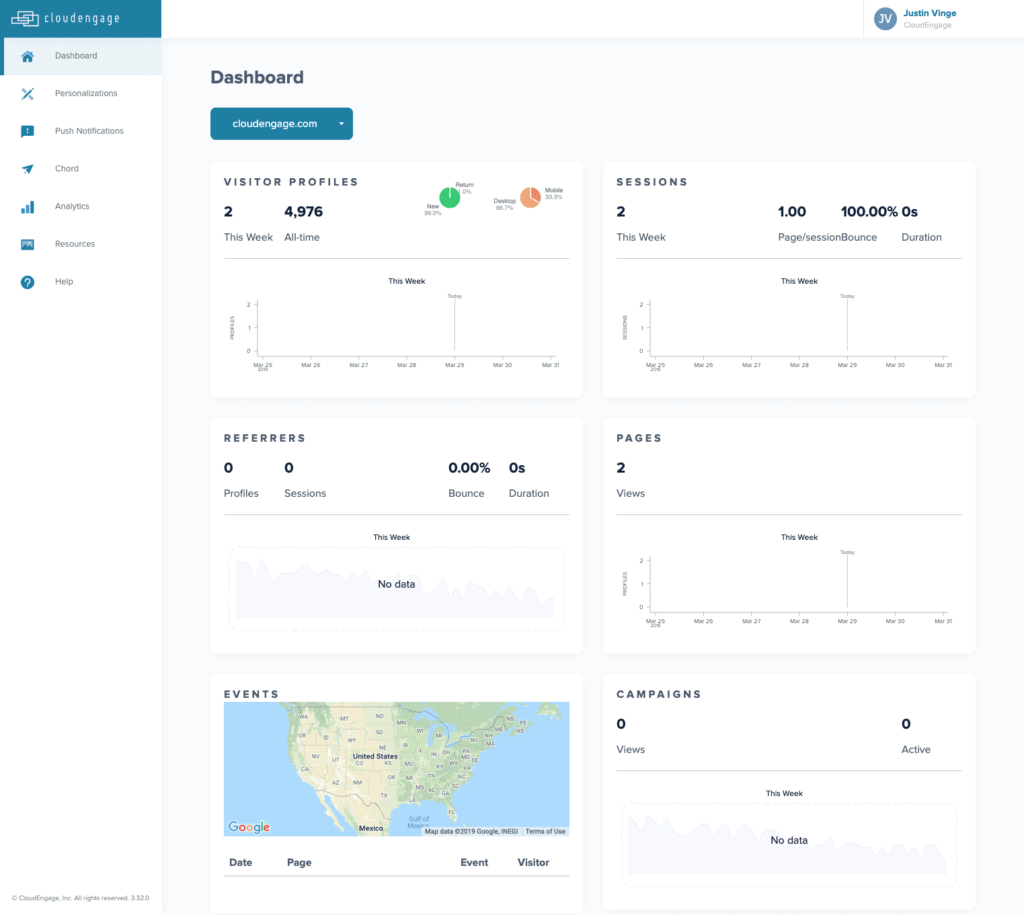
The selection at the top, with your web domain shown, is a dropdown you can use to select any one of the sites you have. The stats displayed are collected following a successful CloudEngage script install on your website.
On the dashboard you can see the stats for views, actions and conversions for each campaign, modal, alert, push notification according to the parameters set. Additionally, you can gather insights from the viewport information that will let you know how many users are being reached on Desktop or Mobile.

Related Articles
CBT News: Dealership geo-fence marketing
Location, location, location! It is usually the difference between a shopper looking for an off road capable 4×4 or a city dweller in need of an eco-friendly Nissan Leaf.
CloudEngage Acquires AnswerDash, Leader in AI powered Self-Service Support
We’re thrilled to announce that we’ve acquired Seattle-based AnswerDash, expanding our suite of offerings to Include AI powered self-service support SPOKANE, Wash., AND SEATTLE, Wash., June 23rd, 2020. Our entire team recognized the fit with AnswerDash was terrific....
Subscribe & Follow
Join Our Newsletter
Subscribe to our email list for news and offers. Follow us on social media.
